Vizzie is an easy-to-use mapping and analytics platform that connects you to the world's open data — no downloads, no GIS specialists. Just beautiful maps, charts, and data stories.
Now in beta — a working version is live, and we're welcoming early users.
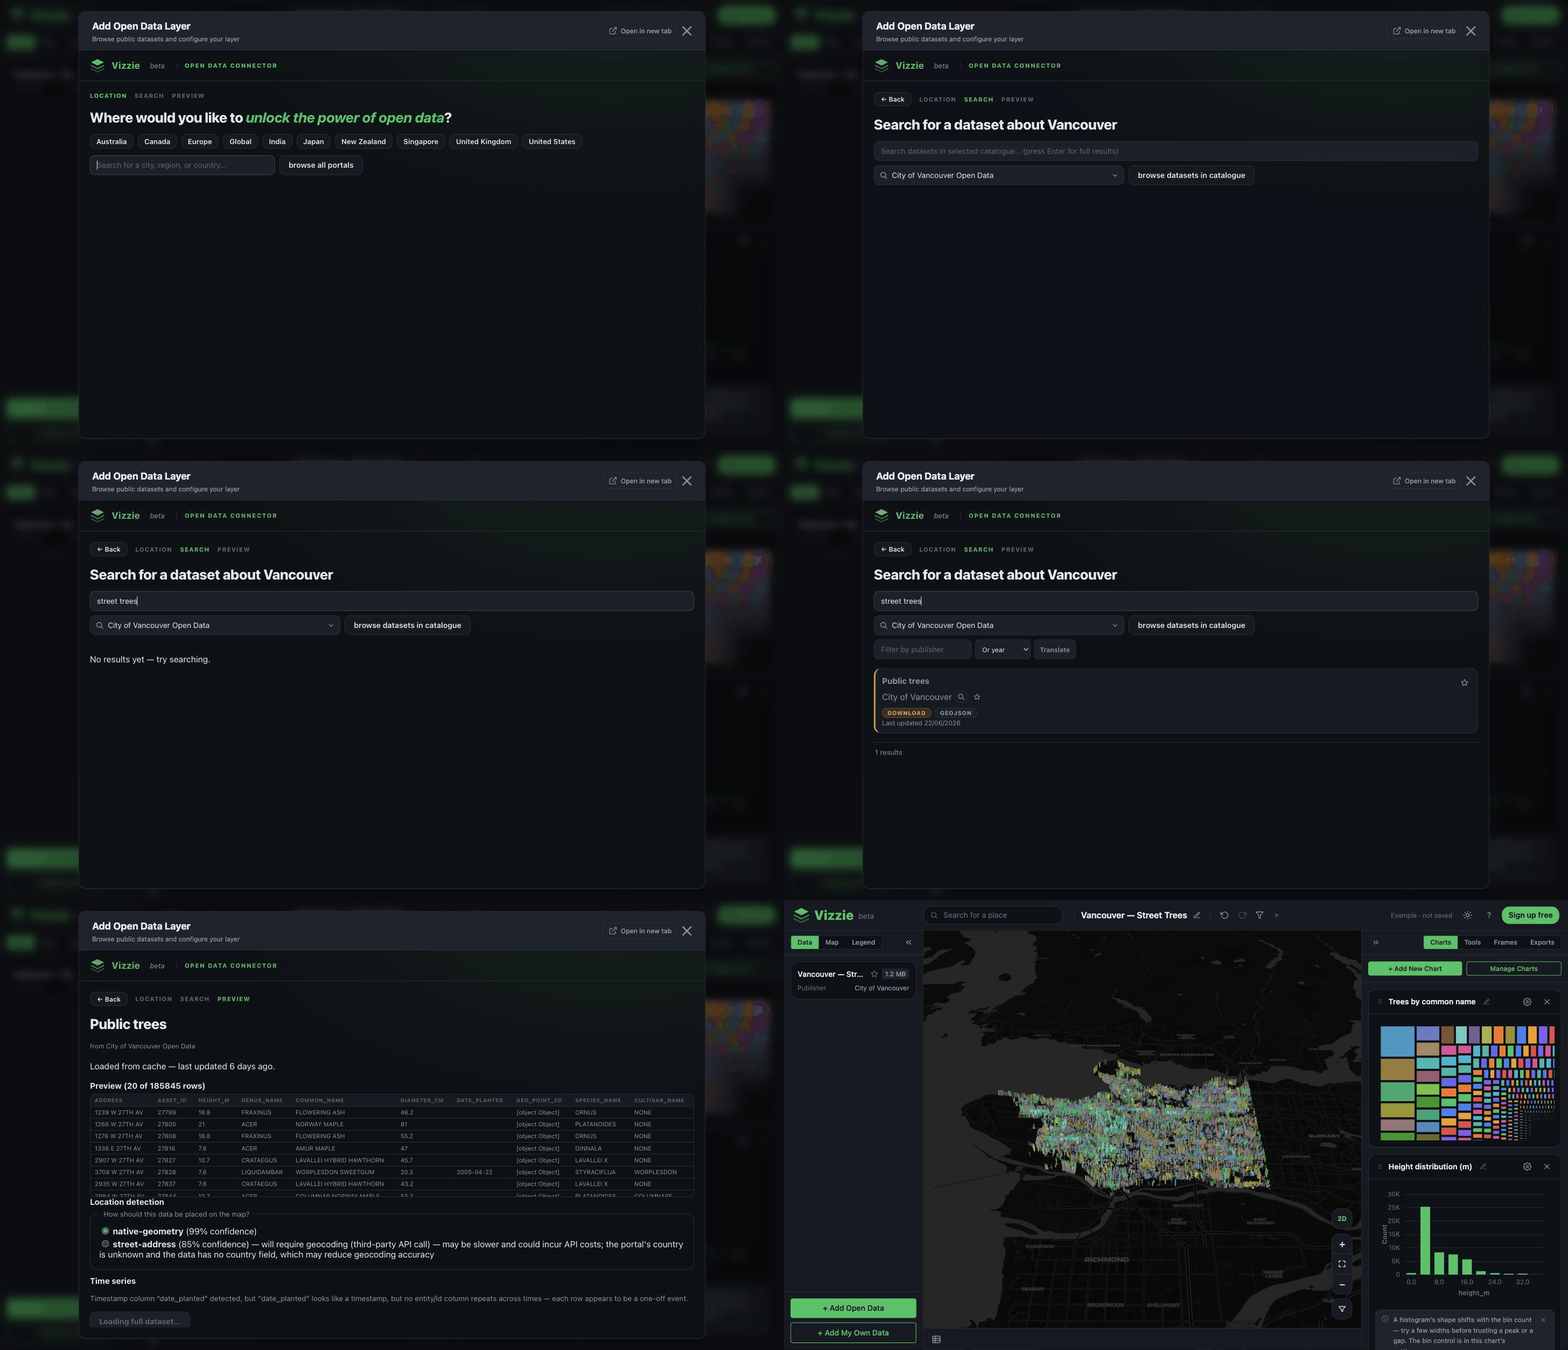
Browse and connect to thousands of open-data portals around the world, live — nothing to download or reformat.
Map, chart, and analyse place-based data together on one linked canvas — powerful spatial analysis, without needing to be an expert.
Turn what you find into presentation-ready maps and interactive stories you can publish and share with a link.
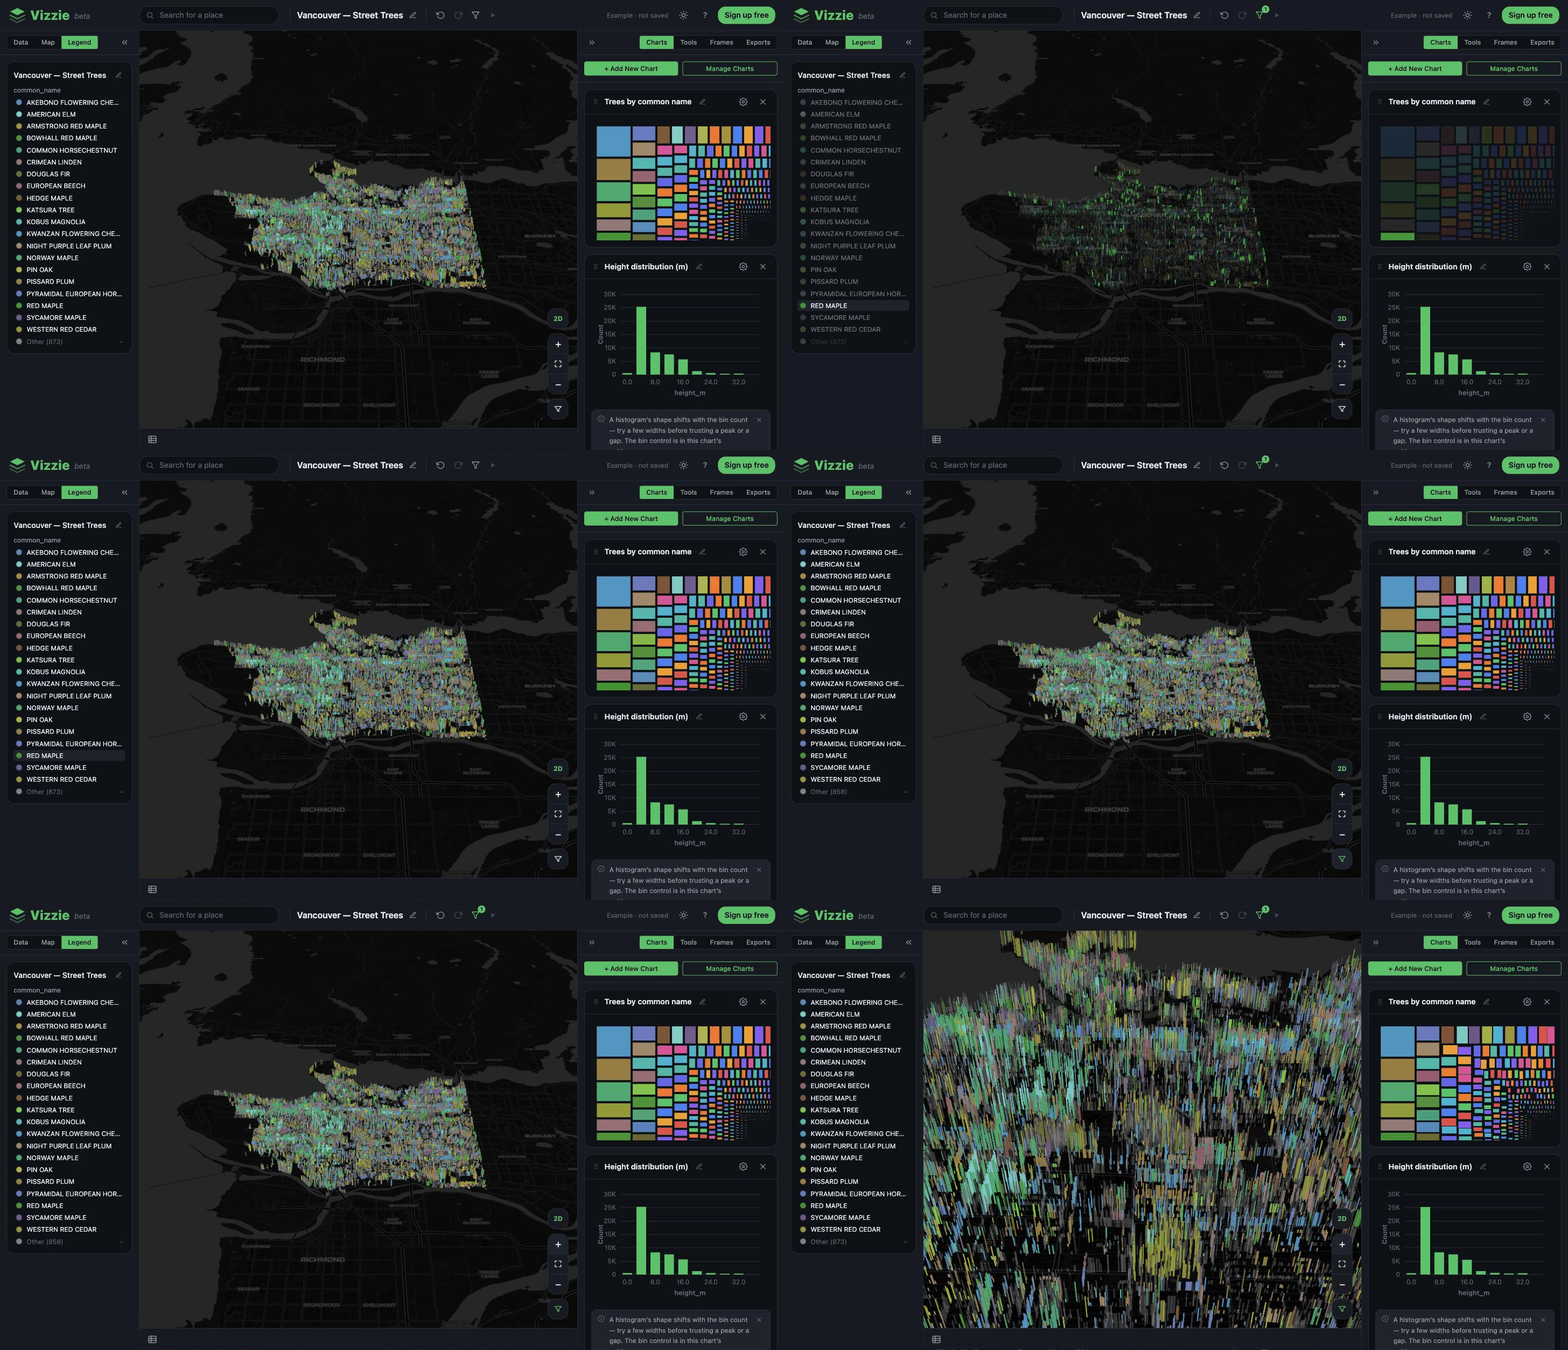
Vancouver's 150,000 street trees — connected live, mapped in 3D, and charted, all in one place.
…and new portals added regularly. Counts as at 6 Aug 2026.
Map ~150,000 street trees by species, size, and location — perfect for greening, canopy, and heat-island work.
See sea-level projections and coastal erosion along the coastline, straight from national data sources.
Explore how freight moves by corridor and commodity across the EU, mapped and charted together.
Understand neighbourhoods by income and household make-up, down to the block-group level.
All of this data is already public and free. Vizzie just makes it usable — connected live, mapped, and ready to share.
Aligned with the Open Data Charter.
We're welcoming early users and would love your feedback. Create a free account, or say hello.
Questions? Email hello@vizzie.org.